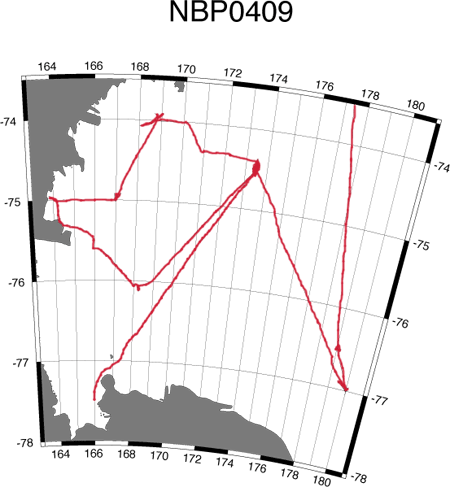
This was the "summer" cruise to the Ross Sea polynya during bloom and post bloom conditions. December 2004 - January 2005.

Microbial Biomass and Production in the Ross Sea, Antarctica
GRINCHES Cruise NBP04-09
| Bact production | |||||||
| Date | Year | Julian Day | Latitude | Longitude | Bacterial cells/L (10e8) | Chla (µg/L) | pmol leu/L/hr |
| 27-Dec-04 | 2004 | 362 |
-76 30.005 |
179 00.031 |
1.16 |
5.21 |
9.27 |
| 28-Dec-04 | 2004 | 363 |
-76 30.001 |
179 00.021 |
1.15 |
4.51 |
9.52 |
| 29-Dec-04 | 2004 | 364 |
-76 30.402 |
179 00.000 |
1.41 |
14.51 |
|
| 30-Dec-04 | 2004 | 365 |
76 55.867 |
179 45.422 |
1.51 |
5.03 |
17.04 |
| 31-Dec-04 | 2004 | 366 |
-77 00.051 |
-179 59.942 |
1.1 |
4.58 |
25.85 |
| 2-Jan-05 | 2005 | 2 |
-74 30.00 |
173 30.00 |
1.04 |
5.46 |
4.05 |
| 4-Jan-05 | 2005 | 4 |
-74 30.00 |
173 30.00 |
1.43 |
3.96 |
11.09 |
| 5-Jan-05 | 2005 | 5 |
-74 30.00 |
173 30.00 |
2.16 |
4.28 |
16.29 |
| 7-Jan-05 | 2005 | 7 |
-74 28.00 |
173 31.00 |
3.08 |
4.56 |
1.24 |
| 8-Jan-05 | 2005 | 8 |
-75 00.256 |
167 00.226 |
4.06 |
37.74 |
|
| 9-Jan-05 | 2005 | 9 |
-74 60.00 |
167 00.00 |
3.27 |
45.67 |
|
| 10-Jan-05 | 2005 | 10 |
-75 00.00 |
167 00.00 |
4.1 |
3.27 |
26.45 |
| 11-Jan-05 | 2005 | 11 |
-74 56.50 |
167 02.20 |
4.61 |
2.5 |
55.35 |
| 12-Jan-05 | 2005 | 12 |
-74 59.90 |
167 00.00 |
5.73 |
2.54 |
32.37 |
| 15-Jan-05 | 2005 | 15 |
-74 30.00 |
173 30.00 |
3.55 |
21.33 |
|
| 16-Jan-05 | 2005 | 16 |
-74 30.00 |
173 30.00 |
4.5 |
3.18 |
15.13 |
| 17-Jan-05 | 2005 | 17 |
-74 30.00 |
173 30.00 |
3.87 |
3.32 |
11.33 |
| 18-Jan-05 | 2005 | 18 |
-74 30.00 |
173 30.00 |
2.09 |
2.46 |
12.45 |
| 19-Jan-05 | 2005 | 19 |
-74 30.00 |
173 30.00 |
1.89 |
2.68 |
10.96 |
| 20-Jan-05 | 2005 | 20 |
-74 30.00 |
173 30.00 |
2.03 |
12.4 |
all data are from CTD hydrocasts from bottles tripped at 5 m depth
cells/ml are bacterial DAPI direct counts
Bacterial Production: pmol Leu/L/hr is 3H-leucine incorporation by the Smith and Azam (1992) method
Chla was determined by fluorescence of 90% acetone extraction of GF/F filters